
Data science products produce predictions: the picture portrays a cat; the user is likely to convert on an ad for product X; the` value of this house is €250,000. By summarizing an array of information into one simple prediction, the information becomes actionable: We are able to show the right ad at the right time and we know for which price we should put our house on the market.
Many machine learning models still provide point estimates, i.e. single numbers. However, predictions are never given with 100% certainty. Predictions are provided using a model, an abstraction of reality, that relates certain characteristics to an outcome. This model may be unsure what to predict for a given input for many different reasons. One reason could be that the model does not capture reality very well, for example because important characteristics are missing from the model or because the relationship between the characteristics and the outcome is fuzzy. Another reason could be that the model has seen too few examples to establish a strong correlation between input and output. Very often, it is useful to go beyond the point estimate and include uncertainty.
In some cases, knowing about the uncertainty in a prediction may change the action that should be taken based on that prediction. Let’s take the case of predicting house prices as explained in part 1 (link) of this blog series to see how your actions could depend on the certainty of the prediction. Suppose you want to sell your house and would like to know for which price you could put it in the market. Using information about many different houses that have been on sale recently as input, a machine learning model predicts that your house should be put in the market for €250,000. Great, that lines up with your expectations and you go ahead and put your house up for sale for that price. Now what if the model would not only give you that prediction, but would also predict that there is a 90% probability that the house will sell for a price in the range of €240,000 and €260,000? That still sounds like a pretty safe bet, so this will probably not change your decision on the asking price of your house. However, what if the model would predict that there is a 90% probability that the house should cost between €150,000 and €350,000? Would you then still go ahead and put down an asking price of €250,000? Probably not, because there is such a high probability that you either ask too little and are missing out on a substantial sum of money, or you are asking too much and making your house unsellable. In this case it would be wise to search for additional information, like asking the opinion of a domain expert (a broker in our example), before going ahead. Knowing the uncertainty of the predictions in this case helped you to avoid making a potentially very bad decision.
In the case of house prices it becomes quite obvious that knowledge about uncertainty can affect decision making. This is surely not the only scenario imaginable. Would you feel comfortable relying on either over confident medical software or autonomous cars? When developing a new product it is always wise to take a moment to step into the shoes of the end user (be it a human or a system) and ask yourself if it would make a different decision if information on the uncertainty of a prediction was available.
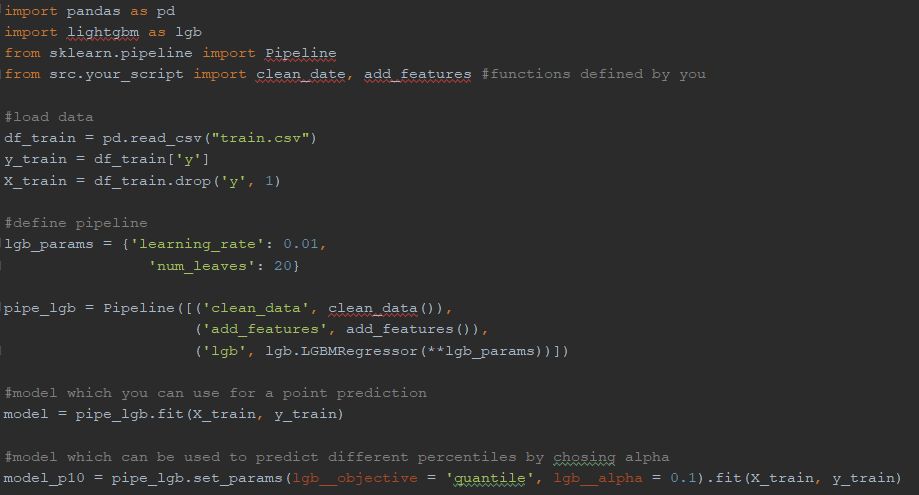
Integrating information about uncertainty in data science products can be done in a variety of ways. In the case of Huispedia we decided to make use of quantile regressions to predict several percentiles of the distribution, giving us an upper bound and a lower bound for the predicted house prices. Figure 1 shows the difference between the estimated upper- and lower bounds divided by the point estimates. We can conclude that the relative uncertainty is lower in more densely populated areas. Estimating quantile regressions requires a tweak in the loss function of your regression model. We used the python implementation of lightgbm, where this is as simple as changing the objective for your model. Figure 2 contains an example code snippet showing how you can train a quantile regression model in python.
For those interested in the different approaches to calculating uncertainty, these are some interesting blogs and books on both quantile regression and other methods:
In our next and final blog we will focus on a crucial part in data science projects: putting the model in production.
Figure 1 - Relative uncertainty is smaller in more densely populated areas.
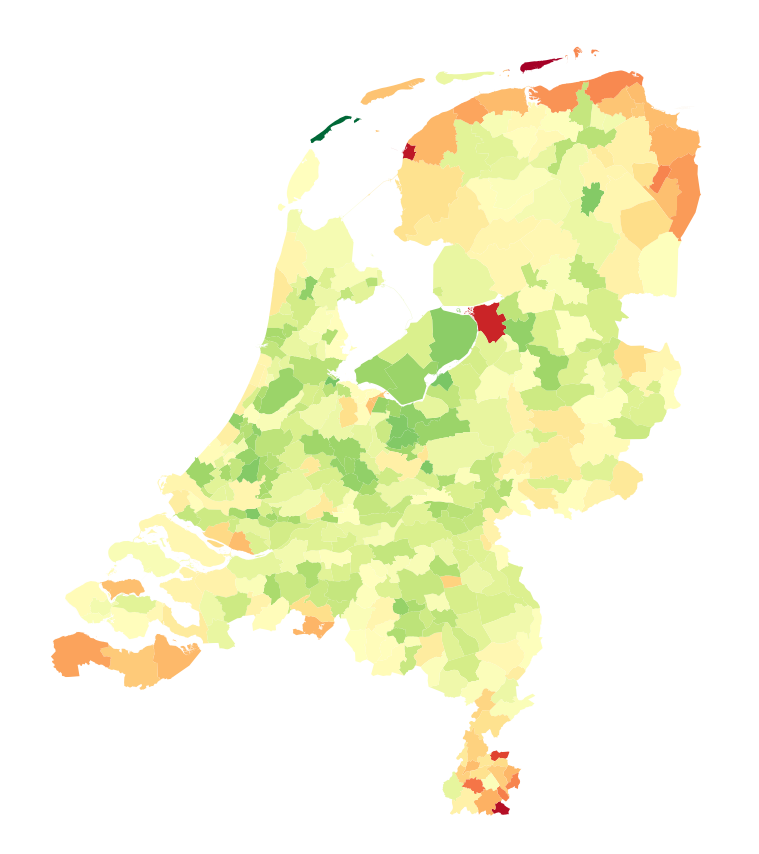
Figure 2 - Example code for doing quantile regressions with lightgbm in python.