
.jpeg)
Hint: don’t forget to configure the Nginx reverse proxy server
At the end of 2019 Deeplearning.ai reported that only 22% of companies that use machine learning actually deployed a model. Most companies do not get beyond a proof of concept, often by means of a model in a Jupyter Notebooks. As a result, numerous companies are hiring machine learning engineers who can build machine learning models and put them in production as well.
Data scientists should be at least familiar with some methods of productionizing models. The most important tool in a data scientists toolbox for this purpose is Docker. Docker is a container service that enables you to deploy a model or application beyond your local machine. For example, running it on Amazon Web Services (AWS) or on Google Cloud Platform (GCP). Several frameworks exist to build applications and serve your models within these Docker containers. As many data scientist already know Python, Flask is easy to start with. In addition, Flask provides you with the opportunity to build a (simple) user-interface so your users will be able to interact with your models without having to learn how to use the command line interface or make an API request.
In this hands-on tutorial I will show you how to deploy a simple Flask application in a Docker container on AWS Elastic Beanstalk and how to add a logging functionality, so your users will be able to see what’s happening behind the scenes. The application will not contain any machine learning models, but you can easily extend it on your own. When I first deployed this solution, I had some trouble with getting it to work, as I had to configure the (reverse) proxy server on AWS. In the last part of this tutorial I will show you how to do this.
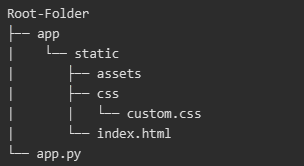
Folder structure for our Flask application
First, we set up the basics of our Flask application. It includes an app.py file for all Flask code, a static index.html file to format the structure of our index page and a css stylesheet (custom.css)
The app.py has only 7 lines of code. We first initialize a Flask application class and define the static and template folders. Then we define a route (‘/’) and tell the application that it should render index.html. The last line tells the application to expose itself on port 5000. The host arguments is set to 0.0.0.0 for deploying it on AWS Elastic Beanstalk later on.
The HTML and CSS files are also quite simple and for the sake of completeness demonstrated below. We define a logging_window class with some style options that will contain the logging later on.
We are now able to run our application for the first time to see what it looks like. As you can see still nothing special.
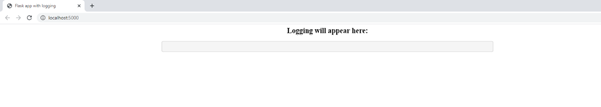
Screenshot of the first version of the application
As mentioned before, displaying the logging of your Python processes will make it a lot easier to work with your application. For example, users can see if a process is stuck or still running and they should be patient.
To add logging to our application is quite easy. It requires a helper function flask_logger, that (in this example) returns the current datetime as an encoded string every second. In addition, we add a new route (‘/log_stream’) that will return a Flask Response class with the output of our flask_logger function. In addition, don’t forget to import datetime for this example.
If we go to the newly created route (which will be exposed at https://localhost:5000/log_stream), we will now see the following. Not very nicely formatted, but it returns the datetime every second.
As we are now able to display an output every second, we can actually display our logger. For this, we have to change our flask_logger function. First, we have to configure our logger. In this example, I will use the logger from loguru but you can use any logger you like. The logger will be configured to write all logs to a file job.log which is located in the static folder. The flask_logger will be configured to read the log-file every second and return the logs. In addition, the log-file will be cleaned after 25 iterations.
This will result in better formatted logging. Be aware that all information that is logged with the loguru logger (in all python processes) will be displayed as these are all written to the job.log file after configuring the logger. So, if you have a line of code logger.info(‘Model is training’) in your training process, it will show up in our logger as well.
Formatted logging read from the job.log file
Include logging into our index page
The last step before we can deploy our application is to include the logging in our created index.html. This is fairly easy, but includes a bit of JavaScript. We create a function that starts after the page has been loaded, makes a GET request to our /log_stream route and writes the response to an HTML element with the id ‘output’. The whole HTML file will look something like this:
As you can see we now have an application that logs all our python processes and displays them to our users.
Log streaming included in our index.html file
Now we can deploy our simple application to AWS Elastic Beanstalk so it can be accessed by anyone. Elastic Beanstalk is a so-called ‘orchestration service’ which not only takes care of the deployment of our application, but also sets up server instances, takes care of load balancing (distribution of tasks over your computing resources if multiple instances have been instantiated to make the overall process more efficient) and monitoring the health and status of your application.
For this step we need two more files in our project’s root folder: a Dockerfile to containerize the application and a requirements.txt containing all the packages that should be installed in this container. Copy-paste the outcome of the pip freeze command to the requirements.txt and set up the Dockerfile as follows.
Now it is time to let the magic happen. There are several methods to deploy your application to AWS Elastic Beanstalk (assuming you already have an AWS account. If you have not, sign up for 12 months of free tier access on aws.amazon.com). The most convenient method is to install the command line interface of Elastic Beanstalk. After you have installed it, navigate to your project’s root folder with the terminal. Subsequently call eb init and eb create and answer the prompted questions. Elastic Beanstalk will automatically recognize there is a Dockerfile in your project’s folder and will start building the environment. Wait a few minutes (check the progress through the management console of AWS) and afterwards you can access your application via the URL you have defined during the initializing process. You can also find this URL if you navigate to your Elastic Beanstalk environment via the AWS management console.
However, if you visit the URL of your application you will see that no logging is appearing. After 25 seconds all logs appear simultaneously. To fix this, we have to configure the Nginx reverse proxy server that is being instantiated by default if an Elastic Beanstalk environment is created. Configuring this server may sound scary, but actually it is quite simple. To understand what we are doing, let me explain where the problem comes from.
As mentioned before, an Nginx reverse proxy server is started when creating the Elastic Beanstalk environment. This proxy server is intended to map your application to your environment’s load balancer. However, one of the feature of Nginx is that it buffers all responses our application is generating, until the process of generating logs is completed. As we would like to display all logs immediately, we have to configure the proxy server to stop buffering them.
Configuring Nginx can be done in 2 steps: 1) create a .ebextensions folder in your project’s root folder, 2) add a config file to this folder (it doesn’t matter what it’s name is, as long as it has a .config extension). The content of this file should be:
Now we can call eb deploy in the terminal from our project’s root folder to update our application and wait for the changes to be deployed.
NB: if you have initialized your project’s root folder as a GitHub repo as well, be sure to commit your changes before deploying the new version of the application. By default, only changes that have been committed will be deployed with the eb deploy call. You can also run eb deploy — staged; then your staged changed (so you have to git add them as well) will also be deployed.
After the deployment, visit your application’s URL and you can see the logging is working as expected!
Following these steps, it is fairly easy to create and deploy a simple Flask application with logging functionality in an AWS Elastic Beanstalk environment. Feel free to extend the application to serve your machine learning models and bring them in production using this easy method!